How to Measure RPM Program Success: Key Metrics Guide
Research-based analysis of how health systems measure RPM program success using engagement, utilization, financial, and workflow metrics.
Measure RPM program success metrics is the kind of phrase people use when a pilot is already live and the easy enthusiasm has worn off. By that point, the real questions are operational. Is the program actually reducing utilization? Are patients staying engaged long enough to matter? Are nurses spending time on the right patients? And does the reimbursement picture justify expansion? For hospital leaders, RPM success is rarely one number. It is a stack of clinical, financial, and workflow signals that together show whether the program deserves a bigger footprint.
"Home digital monitoring significantly reduced hospitalizations, emergency department visits, and total hospital stay days at 3 and 6 months after enrollment." — Hui-Wen Po, Ying-Chien Chu, Hui-Chen Tsai, Chen-Liang Lin, Chung-Yu Chen, and Matthew Huei-Ming Ma, Journal of Medical Internet Research prospective cohort study (2024)
Which RPM program success metrics matter most
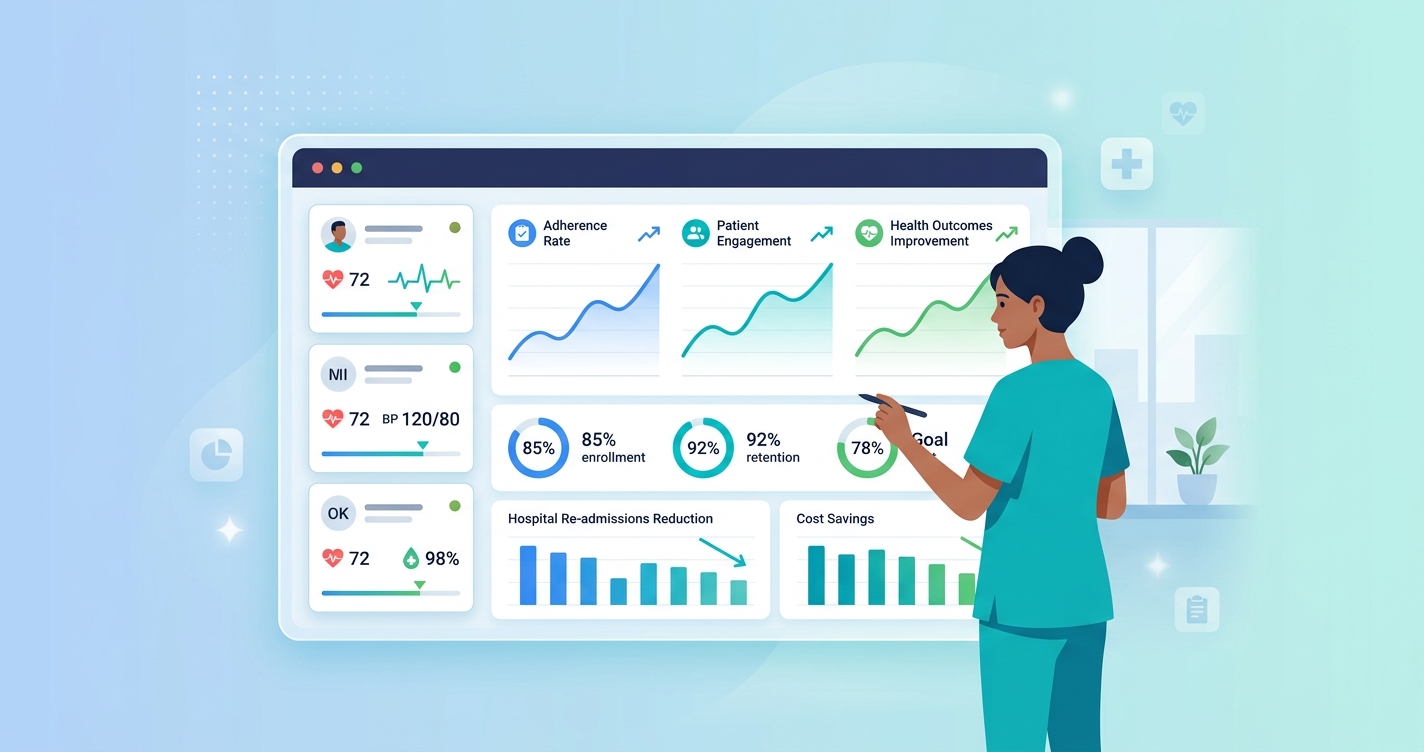
A lot of RPM dashboards overweight activity and underweight outcomes. Device shipments, alert counts, and app logins can be useful, but they do not answer the board-level question. Success usually comes down to four buckets.
First, clinical impact. That includes readmissions, emergency department use, length of stay, escalation timing, and condition-specific outcomes. Po and colleagues reported that high-risk post-discharge patients in a home digital monitoring program had lower hospitalizations, fewer ED visits, and fewer total hospital days over both 3-month and 6-month follow-up periods. Hemali Patel, Amy Hassell, Angela Keniston, and Christopher Davis also found in Telemedicine and e-Health that remote patient monitoring for patients discharged with COVID-19 was associated with shorter hospital length of stay, which matters when capacity pressure is part of the business case.
Second, patient engagement. A program that improves outcomes in a narrow group but loses half its population by week two is hard to scale. Engagement metrics include enrollment conversion, activation rate, measurement completion rate, adherence across 30 days, and time to dropout. Luiza Palmieri Serrano and coauthors, in a systematic review in The Permanente Journal, found that practitioners consistently viewed continuous monitoring and improved patient self-care as benefits of RPM, but they also flagged workload, onboarding friction, and patient anxiety as barriers. That makes engagement both a patient metric and a program-design metric.
Third, operational efficiency. Hospital RPM leaders need to know whether monitoring is helping staff work differently, not just work more. Useful indicators include alert-to-escalation time, percentage of alerts that require clinical action, nurse panel size, documentation time, and the share of patients whose monitoring can be handled through protocol rather than ad hoc outreach.
Fourth, financial performance. That includes reimbursement capture, cost to serve, staffing cost per monitored patient, avoided utilization, and contribution margin by pathway. In 2026, CMS also expanded RPM billing flexibility with new shorter-duration code options alongside the established 99454, 99457, and 99458 framework. That does not make reimbursement the same thing as success, but it does mean finance and operations need to measure the same program with the same definitions.
| Metric category | What to measure | Why it matters | Common mistake |
|---|---|---|---|
| Clinical outcomes | Readmissions, ED revisits, LOS, escalation rate, disease control | Shows whether RPM changes patient outcomes | Looking only at short-term vitals trends |
| Engagement | Enrollment, activation, adherence, measurement completion, dropout | Tests whether patients actually use the program | Counting shipments as engagement |
| Workflow | Alert burden, time to review, escalation speed, documentation time | Reveals whether staff can scale the model | Treating every alert as equally meaningful |
| Financial | Reimbursement capture, cost per patient, avoided utilization, margin | Determines whether expansion is sustainable | Measuring revenue without care delivery cost |
A useful RPM scorecard usually mixes leading indicators and lagging indicators. Engagement and alert handling tell you what is happening now. Readmissions and cost trends tell you whether the model worked.
How health systems usually organize RPM measurement
The cleanest way to think about RPM measurement is by program stage.
- Before launch: define the target population, baseline utilization, and expected staffing model
- During the first 30 to 90 days: watch activation, adherence, alert volume, and protocol fit
- After the pilot period: compare utilization, escalation patterns, and cost against baseline or matched controls
- During scale-up: segment results by service line, risk tier, and care pathway rather than averaging everything together
This matters because a new RPM program can look weak if leadership expects readmission savings before onboarding problems are fixed. The opposite can also happen. A pilot can look healthy because engagement is strong, while downstream utilization never changes.
One practical issue keeps coming up in published RPM work: patient selection. The strongest metrics often appear in post-discharge, chronic disease, and high-risk populations where the need for follow-up is obvious. If a health system enrolls low-risk patients just to fill a dashboard, the utilization signal gets diluted fast.
RPM success metrics for clinical and utilization performance
Clinical and utilization outcomes tend to carry the most weight with CMOs, quality leaders, and population health teams.
The most defensible measures include:
- 30-day and 90-day readmission rates
- ED revisits after discharge
- Observation-to-admission conversion where relevant
- Length of stay for index admissions
- Time from abnormal reading to clinical intervention
- Escalation rate by risk cohort
- Condition-specific markers tied to the pathway being monitored
These are the metrics that connect RPM to real operating pain. If the program is built for post-discharge heart failure, COPD, oncology, or hospital-at-home follow-up, the question is not whether patients enjoyed the app. The question is whether the care team could see deterioration soon enough to act earlier and keep more patients out of acute settings.
That is why utilization metrics should be stratified. A flat readmission average across all patients can hide strong results in one cohort and weak results in another. Health systems get better decisions when they break out results by pathway, diagnosis, age band, digital literacy risk, and staffing model.
RPM engagement and workflow metrics are early warning signs
If clinical outcomes are lagging indicators, engagement and workflow are the operating dials.
The most useful engagement metrics are:
- Enrollment acceptance rate
- Activation within the first 48 to 72 hours
- Percentage of scheduled measurement days completed
- Median days active in program
- Percentage of patients still transmitting or checking in at day 30
- Nonresponse rate after outreach
Workflow metrics matter just as much:
- Alerts per patient per week
- Percentage of alerts closed with no action
- Median response time to high-priority alerts
- Nurse or care-manager panel size
- Minutes spent reviewing each patient per week
- Documentation burden per intervention
Serrano and colleagues' systematic review is helpful here because it captures what front-line teams actually notice. Practitioners valued the visibility RPM provided, but they also reported concerns around workload and implementation friction. That is a reminder that an RPM program can fail operationally even while its technology works fine.
Current research and evidence
Recent RPM literature points in the same direction: programs perform best when success is measured across outcomes, adherence, and workflow.
Po and colleagues' 2024 JMIR prospective cohort study of high-risk post-discharge patients found meaningful reductions in hospitalizations, emergency department visits, and total hospital days after home digital monitoring was introduced. That is useful because it ties RPM performance to utilization, not just device activity.
Patel, Hassell, Keniston, and Davis reported in 2024 that remote monitoring for discharged COVID-19 patients was linked to shorter length of stay. Even though that is a specific use case, it shows how RPM value can show up before the post-discharge period even begins.
Serrano, Maita, Avila, Torres-Guzman, Garcia, Eldaly, Haider, Felton, Paulson, Maniaci, and Forte reviewed practitioner perceptions and found a familiar mix: better continuous monitoring and self-care on one side, heavier workload and implementation challenges on the other. That combination is why RPM scorecards need both outcome metrics and staff-effort metrics.
McKinsey's care-at-home analysis adds a strategic layer. The firm has argued that as much as $265 billion in Medicare fee-for-service spending could shift from facilities to the home for selected services and procedures by 2025. RPM is not the whole care-at-home story, but it is part of the infrastructure that makes more home-based follow-up credible.
Industry applications for RPM success measurement
Post-discharge pathways
In post-discharge RPM, the center of gravity is readmissions, ED revisits, escalation timing, and adherence during the highest-risk first month. This is also where camera-based monitoring gets attention, because reducing equipment friction can improve activation after discharge.
Hospital-at-home and virtual nursing
Here, metrics tilt toward escalation speed, staff coverage, length of stay, and the number of touchpoints needed per patient. Leaders also care about whether monitoring helps nurses cover larger panels safely.
Chronic disease management
For chronic pathways, retention matters more. A program may not prove itself in ten days. It needs to show sustained adherence, clinically meaningful trend visibility, and lower downstream utilization over time.
The future of RPM program measurement
I think the next phase of RPM measurement will look less like raw device reporting and more like service-line economics plus workflow intelligence. Health systems are getting more selective. They want to know which patients benefit, which alerts change care, and which monitoring models scale without swallowing nurse time.
That is where camera-based RPM and other low-friction approaches may matter. If monitoring can start with fewer logistics and better patient follow-through, the success metrics stop being a debate about activation failure and start becoming a debate about clinical design, which is a much better problem to have.
For teams building RPM programs now, the smartest move is not chasing a single headline stat. It is building a measurement model that connects patient engagement, clinical intervention, staff workload, and financial sustainability in one view.
Frequently Asked Questions
What is the most important metric for RPM program success?
There usually is not one. Most health systems start with readmissions or ED revisits, but those numbers can mislead without engagement and workflow context.
How long does it take to measure RPM success?
Engagement and alert metrics can appear within weeks. Utilization and financial performance usually need a longer view, often 90 days or more depending on the pathway.
Should RPM programs be judged mainly on reimbursement?
No. Reimbursement matters, especially for scale, but a program that bills well and fails to improve workflow or utilization is not a strong long-term model.
Why do some RPM pilots look successful early and then stall?
Early pilots often focus on motivated patients and high-touch staffing. Once the program expands, activation friction, alert burden, and inconsistent patient selection become much more visible.
Health systems trying to connect RPM measurement with a broader care-at-home strategy are increasingly looking at lower-friction models, including solutions like Circadify, while keeping the real test where it belongs: can the model improve outcomes, fit workflow, and scale responsibly? For related analysis, see The Clinical Workflow for Camera-Based Remote Patient Monitoring and RPM Billing Codes: Revenue Opportunities for Health Systems.